Please note that our website uses cookies. To learn more about our cookies and how we use them, please read our Privacy Policy.

Data aggregation, normalisation, and time series

Get your data organised
Are your data and reports scattered, making it difficult to make time series plot or infer trends?

Use case
Organise and infer trends from scattered data and reports.
How does it help?
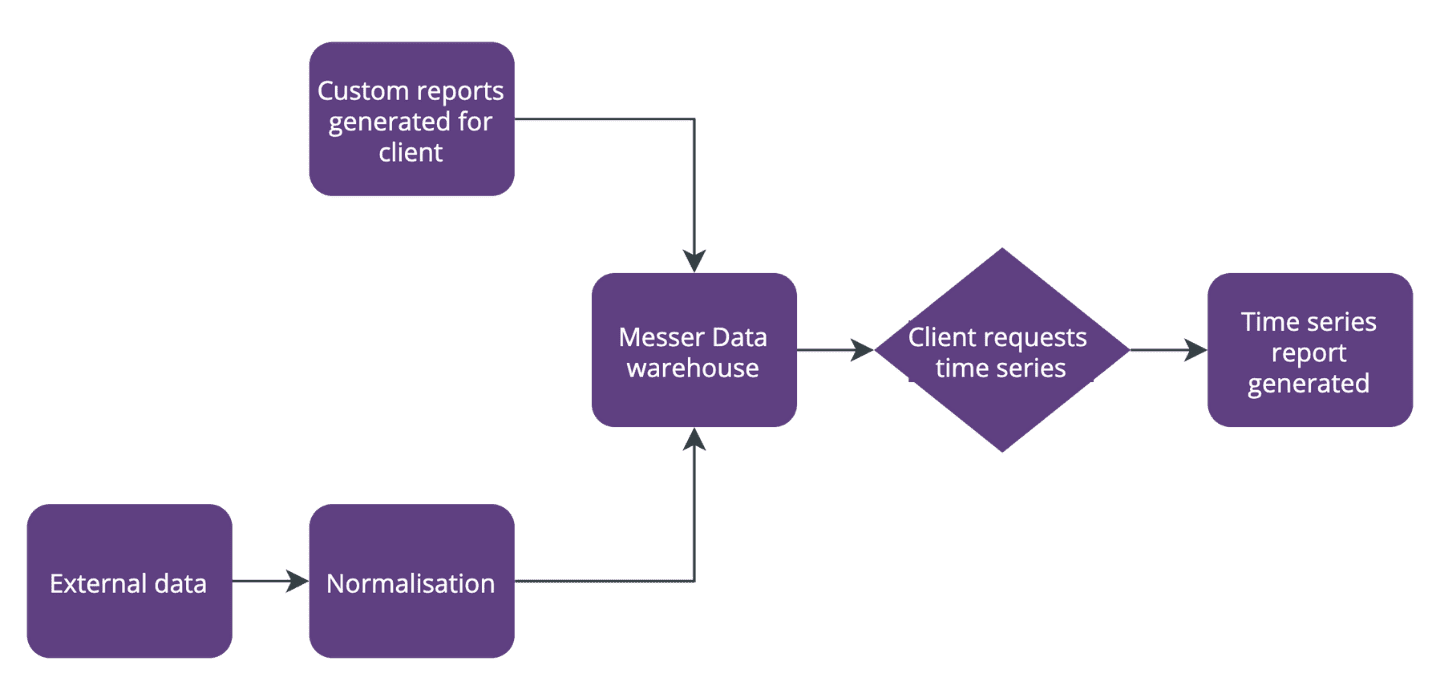
Automate the collection and normalisation of data from various data sources, which will be stored securely in the Messer Data Warehouse. Upon client request, a time series plot can be shown instantly for any time period for which data is available. This service is included with Prodigy but is also available as a standalone workflow.
Key features
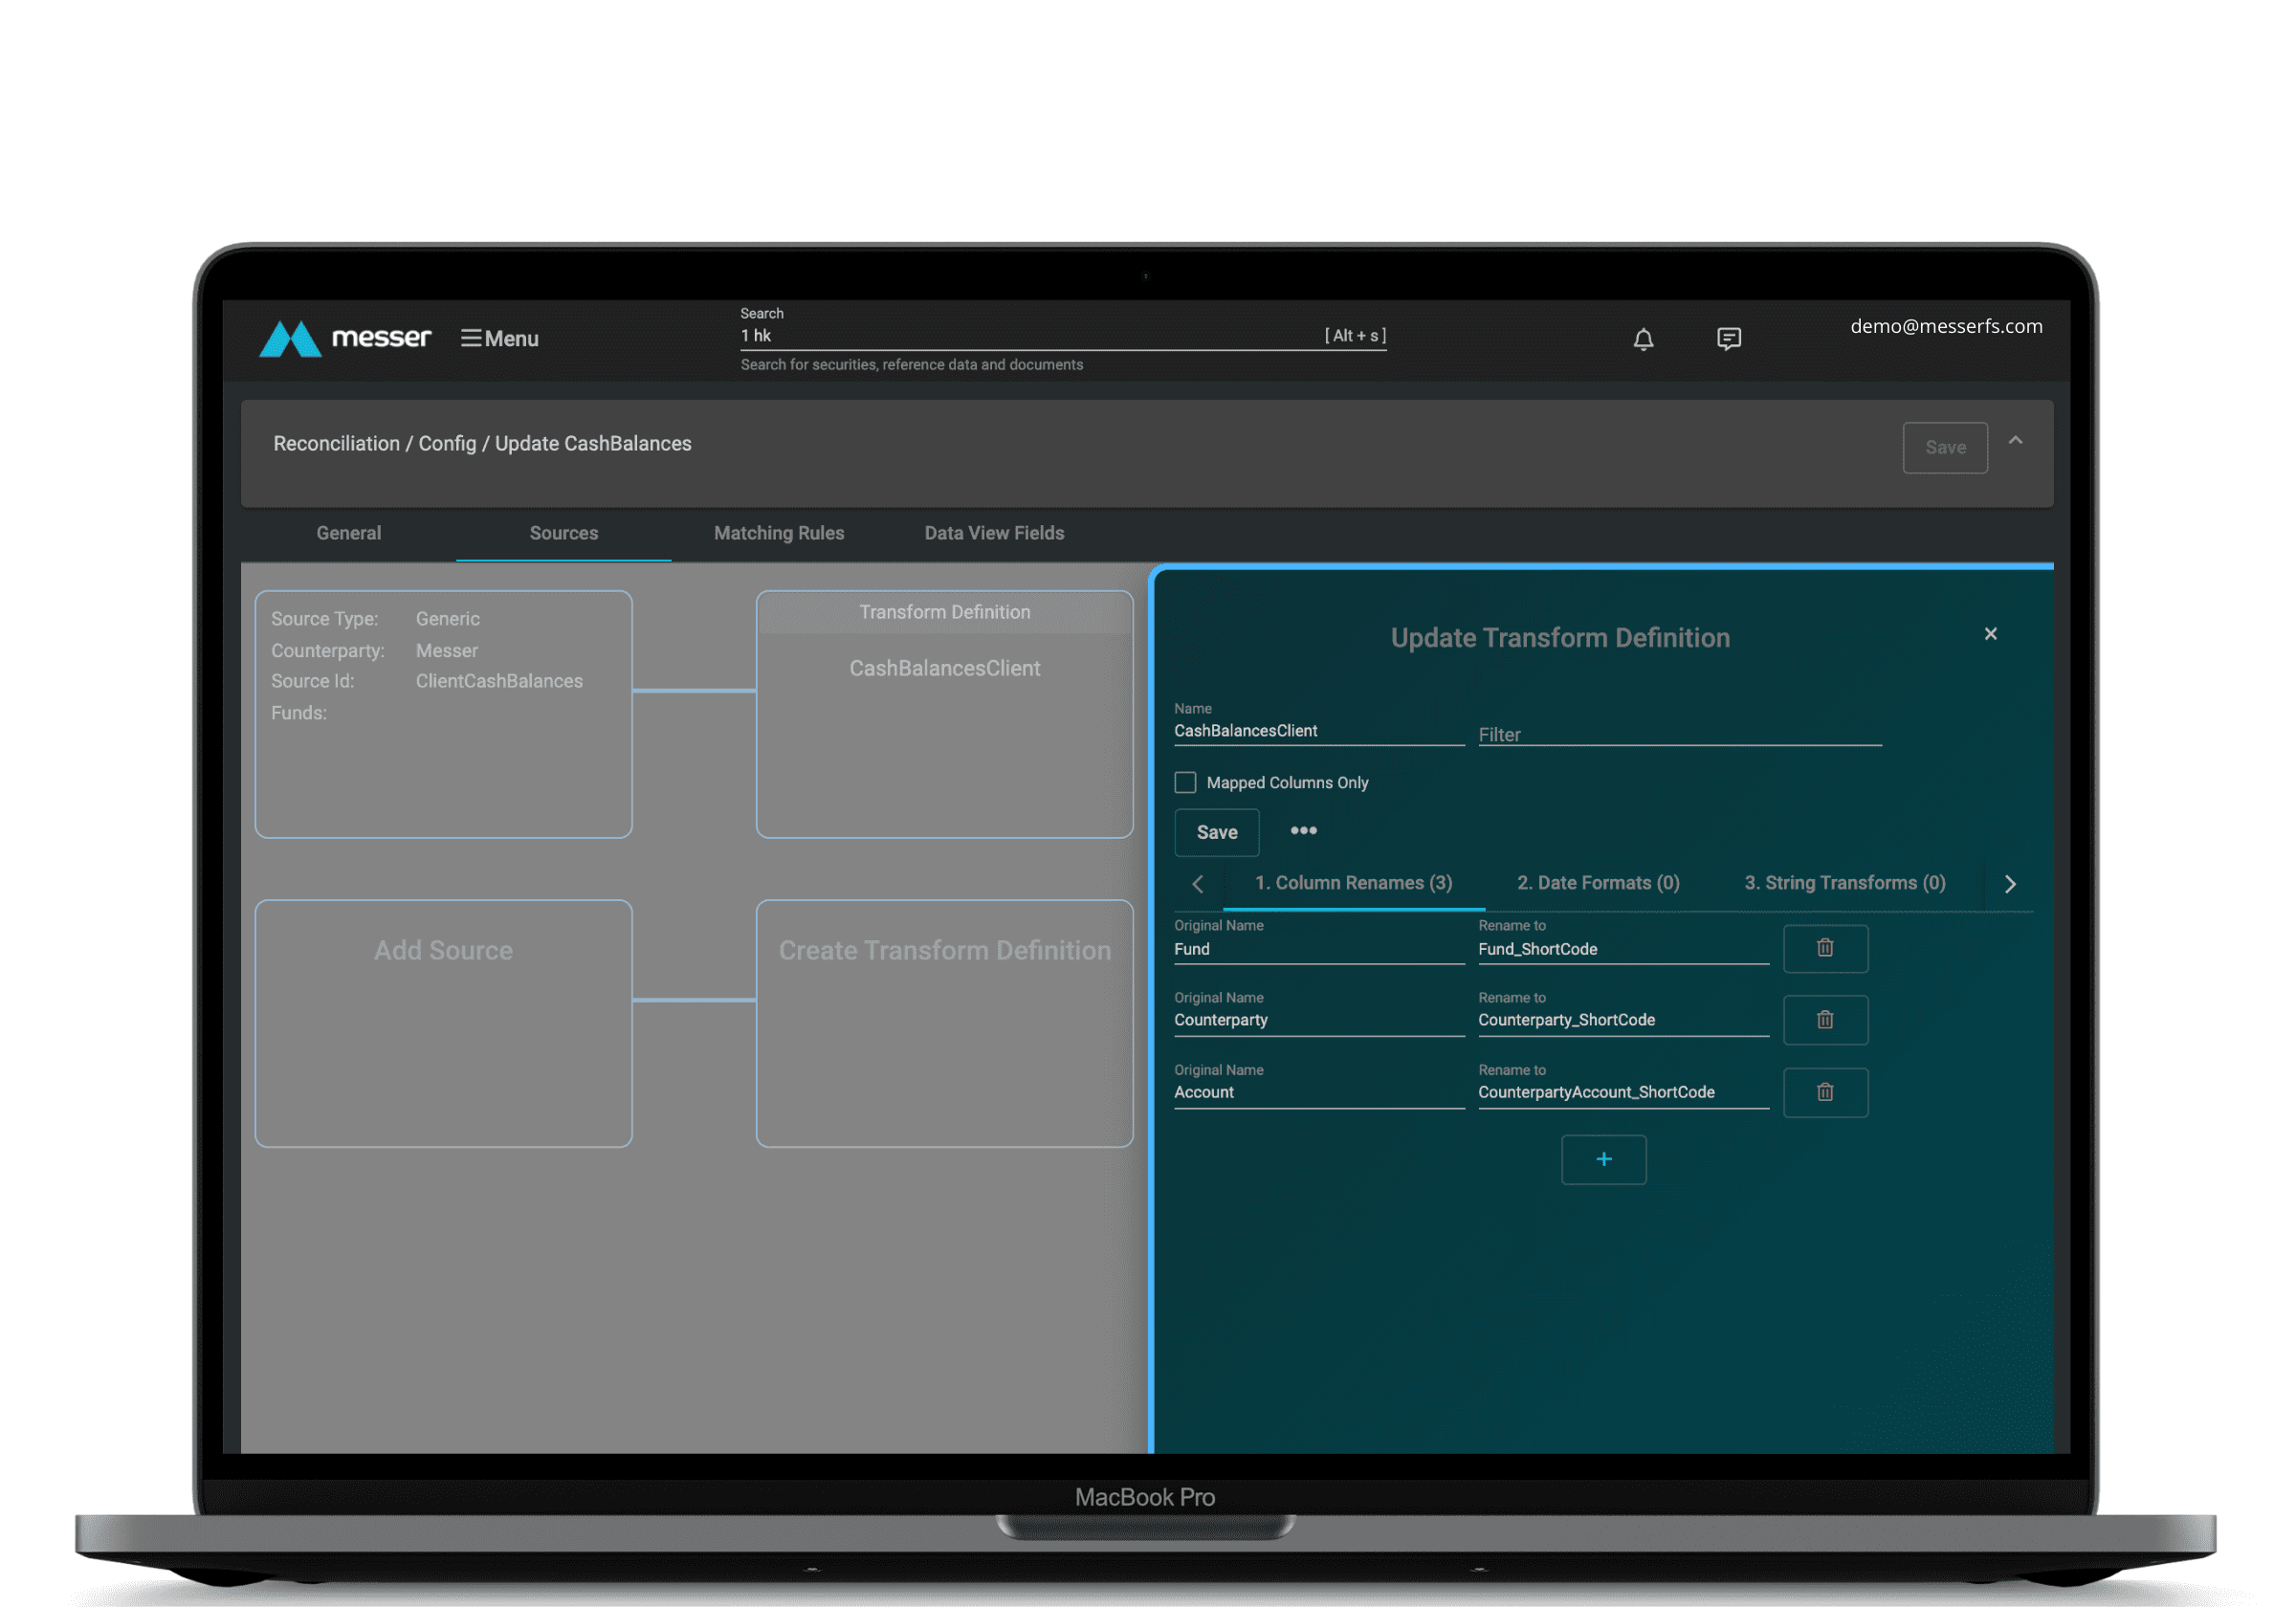
Create any custom fields thanks to our no-schema data model
Create your own security manual, through file import or a data license
Edit anytime: any reporting will take into account the change effective date
Not sure if this is right for you?
Tell us your situation, and we will suggest the best solution tailored to your needs.
Discover more of the messer product range...
Automate reports that your team takes hours per week to do. Our report generation team works with the client to ensure the logic and calculations in their manual report are fully reflected in code and automate file acquisition, report generation and delivery of output.
Discover moreBeing the backbone of Prodigy, our data warehouse allows the modules to communicate seamlessly by integrating all the data in one place.
Discover moreAutomate your data acquisition and organisation using SFTP. You can set up custom alerts to tell you when the files arrive or when they still have not arrived. You can even see trends in file arrival time and errors. Know what’s going on with your files at all times.
Discover more